The Importance of Understanding Technical Analysis Patterns in Stock Trading
As a stock trader, having in-depth knowledge of technical analysis patterns can help you make informed decisions about when to buy or sell stocks. Technical analysis involves analyzing past market data, particularly charts and market statistics, to predict future price movements. By mastering technical analysis, you can better understand market trends, identify potential trading opportunities, and manage your risk exposure.
The three fundamental principles of technical analysis are trends, patterns, and indicators. Trends refer to the direction of stock prices over a period of time, patterns refer to the recurring price formations that occur on charts, and indicators are mathematical calculations based on price and volume data.
Technical analysis patterns can be classified into either reversal or continuation patterns. Reversal patterns occur when a prevailing trend changes direction, while continuation patterns form when a trend pauses before continuing in its original direction. Becoming familiar with these patterns will help you recognize market conditions and make more effective trading decisions.
Support and Resistance Levels
Support and resistance levels refer to price levels where demand and supply intersect and create a temporary halt in a prevailing trend. A support level is a price point where a stock will not typically fall below, as buying pressure tends to increase at that point. In contrast, a resistance level is a price point where selling pressure is high, causing the stock to struggle to rise above that level.
By analyzing support and resistance levels, traders can identify key price points where a stock is likely to experience a significant price reversal. Utilizing this knowledge, traders can set stop loss orders to minimize potential losses and take advantage of profitable trades.
Understanding technical analysis patterns and particularly support and resistance levels, is essential for traders to navigate the dynamic world of the stock market. By analyzing price movements and patterns on a chart, traders can make informed decisions about when to buy or sell a stock.
Trend Lines and Channels
Trend lines and channels are significant tools in technical analysis that help traders identify trends. A trend line is a straight line that connects two or more significant price points, while a channel involves drawing two parallel trend lines around the price movements of a stock. If plotted correctly, these lines can help traders identify potential buying or selling opportunities.
To draw a trend line, locate two significant price points and draw a straight line that connects the two points. This line will act as a support or resistance level, depending on the trend direction. On the other hand, to draw a channel, identify the significant uptrend or downtrend by drawing a trend line connecting the significant highs or lows. Then, draw a parallel line through the other significant low or high.
By understanding trend lines and channels, traders can spot key levels of support and resistance, helping them decide when to enter or exit trades.

Candlestick Patterns and Indicators
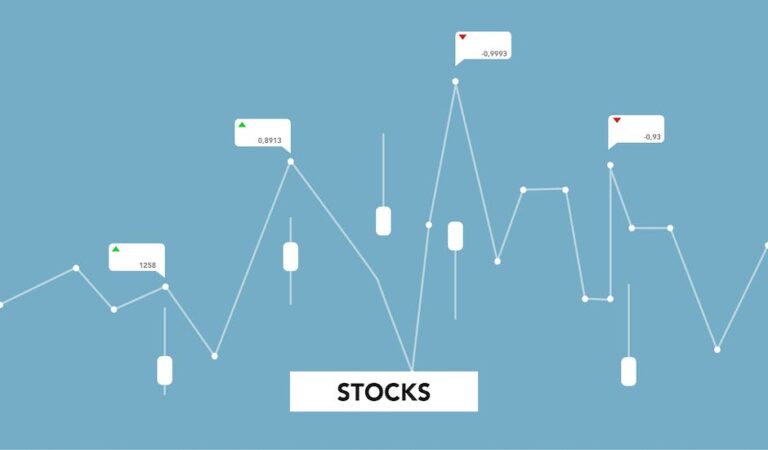
Candlestick patterns are visual representation of price movements that help traders gauge market trends. These patterns, when combined with technical indicators, help traders analyze market fluctuations and better understand the stock’s price trends.
Candlestick patterns are determined by analyzing a stock’s opening, closing, high, and low prices over a specific period. Doji, engulfing, and harami are examples of candlestick patterns that traders use to identify trend reversal or continuation.
Technical indicators, on the other hand, are statistical calculations based on various market data points, such as the volume traded, price changes, and relative strength index. Indicators are used to identify trends and patterns that might be difficult to identify just by looking at a chart.
Candlestick patterns and indicators are significant tools that complement one another. Through these tools, traders can accurately predict the stock’s overall trend and make informed trading decisions.
Identifying Reversal and Continuation Patterns
Reversal and continuation patterns are essential technical indicators that help traders predict major changes in a stock’s trend.
A reversal pattern is a chart pattern that indicates the likely end of a prevailing trend. Often, they indicate a significant price movement is in the offing. Examples of reversal patterns include Head and Shoulders, Double Top, and Triple Top. The confirmation of a reversal pattern depends on the price action that follows the actual chart pattern.
Continuation patterns, as mentioned earlier, indicate a pause in the prevailing trend before it eventually continues. Examples of continuation patterns include Flags, Pennants, Wedges, and Continuation Head and Shoulders.
Understanding how to identify reversal and continuation patterns requires a thorough understanding of chart patterns, technical indicators, and market psychology.
Putting it All Together: Using Technical Analysis to Make Trade Decisions
Technical analysis is not a standalone tool but works best when combined with other types of analysis. Fundamental analysis, market psychology, and volatility analysis all contribute to a comprehensive investment strategy.
Fundamental analysis involves examining a company’s financials to identify its potential future performance.
Market psychology is a critical factor in technical analysis as price movements are often driven by investor sentiment.
Volatility analysis measures how much the price of a stock is likely to fluctuate based on market data.
A good trader understands how to combine these analyses to make informed decisions. By identifying patterns in charts and examining data, traders can buy and sell stocks at opportune points, minimize losses, and maximize profits.
In conclusion, technical analysis patterns form the backbone of a successful trading strategy. Becoming familiar with these patterns, whether reversal or continuation, enables traders to make informed trading decisions and ultimately take control of their financial futures.